Quadratic Equations
What is a Quadratic Equation?
You should know by now how to associate pictorial patterns in graphs with
symbolic patterns in formulas. The main associations that can be have made are summarized
in Figure 1 (below).

Figure 1: Associating pictorial shapes (graphs) with arrangements of mathematical symbols (formulas).
The purpose of making these associations between graphs and formulas is to allow you to
take a set of numerical data, graph it, and then create a formula that does a good job of
representing what is going on.
Once you have that formula, you
can make predictions about what is
likely to happen and be better
prepared for future events.

Examining data, creating graphs
and formulas and making
predictions is a way for you to gain
more insight into how your world
works and what the world is likely
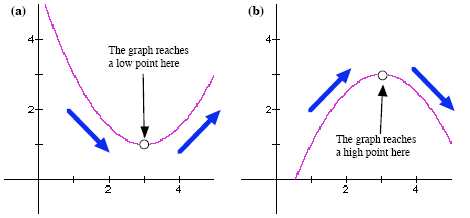
to throw at you in the future. It is very important that you learn how to use a new symbolic
pattern to describe trends that either reach a low point and then rebound (see Figure 2(a))
or reach a high point and then decrease (see Figure 2(b)).
|