Graphing Compound Inequalities
The solution sets for compound inequalities are typically
intervals, rather than half lines. Here is an example to show
why.
Example
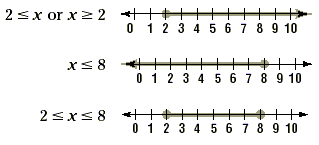
Graph 2  x x  8. 8.
Solution
Remember that the solution set for the compound inequality is
the set of numbers for which both inequalities hold. In the
graph, this means that the solution set can be shown as the
overlap of the two solution sets for the individual inequalities.

Now try to complete the following exercises.
Exercises
Solve each compound inequality. Then graph the solution set.
1) 2 < x - 8 < 5
{ x | 10 < x < 13 }

2) 4 < 2x < 12
{ x | 2 < x < 6 }

3) 4  3x + 4 < 10 3x + 4 < 10
{ x | 0  x < 2 } x < 2 }

4) 7  -x + 1 -x + 1  2 2
{ x | -6  x x  -1 } -1 }

|