The Rectangular Coordinate System
Keep tthe following in mind:
(i) When the coordinates of a point are written as a bracketed
pair of numbers, we always write the horizontal coordinate first
and the vertical coordinate second. This is why (a, b) is often
called an ordered pair. For example, the point
(5, 2) is at a quite different location than the point (2, 5):
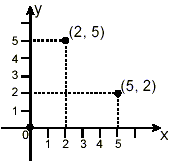
(ii) Since the identity of a point comes from its measured
position or location with respect to the scales on the coordinate
axes, it is mandatory to show the scales on the axes explicitly ,
and to label the axes explicitly. If you omit the scale
markings and labels, you end up with a meaningless graph.
(iii) The graph of a single point is just a dot at the
appropriate location. No additional lines, etc. should be drawn
unless they are requested.
(iv) Points on the horizontal axis have coordinates of the
form (b, 0) – that is, their vertical coordinates are equal
to zero. Points on the vertical axis have coordinates of the form
(0, b) – that is, their horizontal coordinate is zero. The
origin has coordinates (0, 0) – both of its coordinates are
zero.

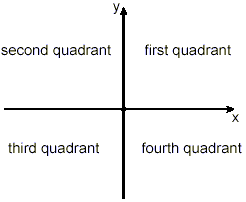
(v) The rectangular coordinate axes divide the plane into four
regions, called quadrants . The quadrants are identified by
number, with quadrant 1, or the first quadrant being the upper
right one. They are arranged as shown:
Plotting Graphs of Formulas
To graph a formula by hand, the usual procedure is to
i) make a table of x and y values for a representative
collection of values of x in the specified interval
ii) plot these pairs of values as points on a rectangular
coordinate system
iii) join the points by a line or smooth curve
Example:
Plot the graph of y = 2x + 3 for x between -3 and +3
inclusive.
Solution:
(i) start by making a table of coordinates of representative
points:
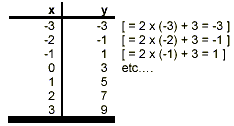
(ii) we need coordinate axes that have x going from -3 to +3
and y going from -3 to +9. Set these up and then plot the points
as dots at the appropriate locations:
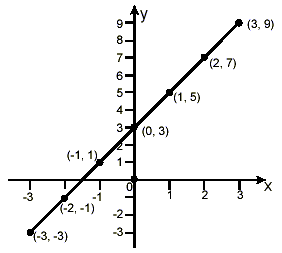
(iii) The points appear to lie on a straight line. Laying a
straight edge on the graph confirms this, so in this case, just
draw a straight line through the points to complete the graph, as
shown above. Had we recognized that the formula, y = 2x + 3, is
the type of formula that gives a straight line graph, we could
have saved ourselves some work, since we would need to plot only
two points to get the entire graph.
Example:
The area, A, of a square with sides of length s is given by
the formula
A = s 2
Plot a graph of A vs s for s = 0 through s = 5.
Solution:
This example illustrates several issues:
(i) People often use the symbols x and y generically when
speaking about graphs. However, we can create a rectangular
coordinate system for any pair of symbols or variables we wish to
use.
(ii) When asked to plot the graph of “A vs. s”, we
are to make the vertical axis the A-axis, and the horizontal axis
is the s-axis:
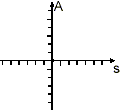
So, here, we start again by making a table of coordinates of
representative points for the graph:
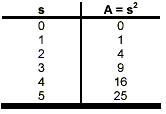
Now, plot the points on a rectangular coordinate system which
has a horizontal (s) axis running from s = 0 to s = 5, at least,
and a vertical (A) axis running at least from A = 0 to A = 25.
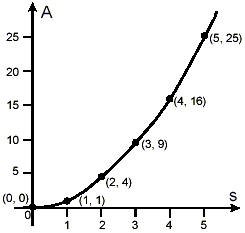
We see in this case that the points appear to follow a curved
path, bending upwards as you move towards the right. The graph
starts out with quite a shallow slope around s = 0, but appears
to get steeper and steeper as we move towards higher values of s.
|