Graphing Horizontal and Vertical Lines
If the coefficient of a variable in a linear equation is 0, then that
variable is usually omitted from the equation. For example, the equation y = 0
· x + 2 is written as y = 2. Because x is
multiplied by 0, any value of x can be used as long as y is 2. Because the y-coordinates
are all the same, the graph is a horizontal line.
Example 1
Graphing a horizontal line
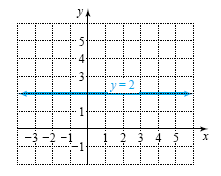
Graph y = 2. Plot at least four points.
Solution
The following table gives four points that satisfy y = 2, or y = 0
· x + 2. Note that it is easy to determine y
in this case because y is always 2.
|
x |
-2 |
-1 |
0 |
1 |
|
y = 0 · x + 2 |
2 |
2 |
2 |
2 |
The horizontal line through these points is shown in the figure below.

If the coefficient of y is 0 in a linear equation, then the graph is a
vertical line.
Example 2
Graphing a vertical line
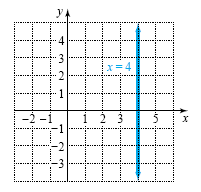
Graph x = 4. Plot at least four points.
Solution
We can think of the equation x = 4 as x = 4 + 0
· y. Because y is multiplied by 0, the equation is satisfied by any
ordered pair with an x-coordinate of 4.
|
x = 4 + 0 · y |
4 |
4 |
4 |
4 |
|
y |
-2 |
-1 |
0 |
1 |
The vertical line through these points is shown in the figure below.

|