Graphing Linear Equations
Graphing Linear Equations which are neither in
slope-intercept form nor in point-slope form
Often equations are neither in slope-intercept form nor
point-slope form. In this case, we can substitute any two
different x values, and solve to find the corresponding y values.
Example
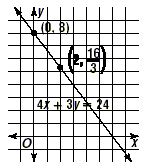
Graph 4x + 3y = 24.
Solution
Choose two x values, say x = 0 and x = 2. (We could have
chosen any two different x values.) Use substitution to find the
corresponding y values.
| 4x + 3y |
= 24 |
|
| 4(0) + 3y |
= 24 |
Replace x with 0. |
| 3y |
= 24 |
|
| y |
= 8 |
Divide each side by 3. |
The point at (0, 8) is on the line.
| 4x + 3y |
= 24 |
|
| 4(2) + 3y |
= 24 |
Replace x with 2. |
| 8 + 3y |
= 24 |
|
| 3y |
= 16 |
Subtract 8 from each side. |
| y |
 |
Divide each side by 3. |
The point at  is also on the line. is also on the line.
Graph the line as shown.

|