Graphing Quadratic Functions
The Graph of f(x) = Ax2 + Bx + C
To graph a quadratic function, first calculate several ordered pairs. Then,
plot the corresponding points on a Cartesian coordinate system. Finally,
connect the points with a smooth line.
Example 1
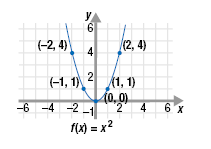
Make a table of five ordered pairs that satisfy the function f(x) = x2. Then,
use the table to graph the function.
Solution
To make a table, select 5 values for x. We will let x = -2, -1, 0, 1, and 2.
Substitute those values of x into the function and simplify.
| x |
f(x) = x2 |
(x ,y) |
| -2 -1
0
1
2 |
f(-2) = (-2)2 = 4 f(-1) = (-1)2 =
1
f(0) = (0)2 = 0
f(1) = (1)2 = 1
f(2) = (2)2 = 4 |
(-2, 4) (-1, 1)
(0, 0)
(1, 1)
(2, 4) |
Now, plot the points and connect them with a smooth curve.

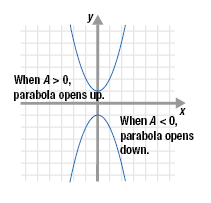
The graph of a quadratic function, f(x) = Ax2 + Bx + C, has a distinctive
shape called a parabola. The sign of the coefficient of x2, A, determines whether the graph opens up or down.
• When A is positive, the parabola opens up.
• When A is negative, the parabola opens down.

Graph the functions and state the domain and range of each.
a. f(x) = x2 + 3
b. f(x) = x2 - 5
Solution
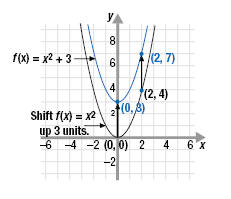
a. Graph The graph of f(x) = x2 + 3 is related to the graph of y
= x2:
For each input value x, the output of f(x) = x2 + 3 is 3 more than the
output of f(x) = x2.
Thus, the graphs have the same shape, but the graph of f(x) = x2 + 3 is shifted up 3 units.
Domain Since we can square any real number, the domain is all real
numbers or (-∞, +∞).
Range We can see from the graph that the smallest value of y is 3.
Therefore, the range is y ≥ 3 or [3, +∞).

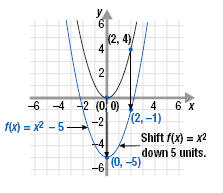
b. Graph To graph f(x) = x2 - 5, we note that for each input value x, the
output of f(x) = x2 - 5 is 5 less than the output of f(x) = x2. Thus, the graph is shifted down 5 units.
Domain Since we can square any real number, the domain is all real
numbers or (-∞, +∞).
Range We can see from the graph that the smallest value of y is -5.
Therefore, the range is y ≥ -5 or [-5, +∞).

|